Mood of the Cities Following M7.8 and M7.5 Earthquakes in Turkey
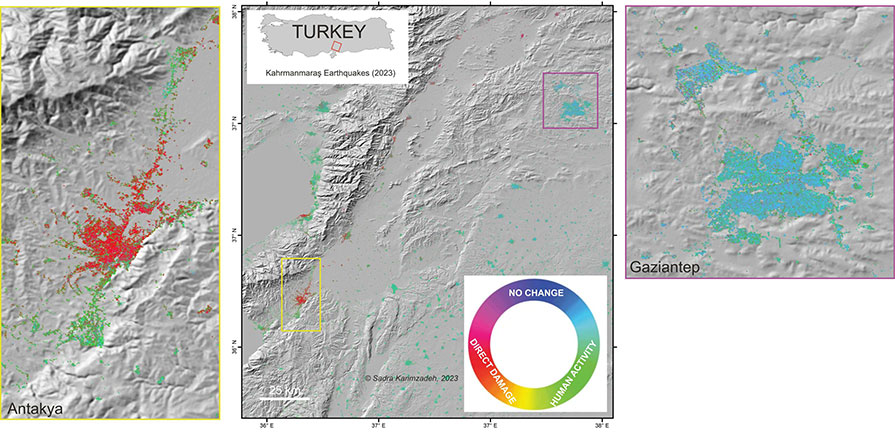
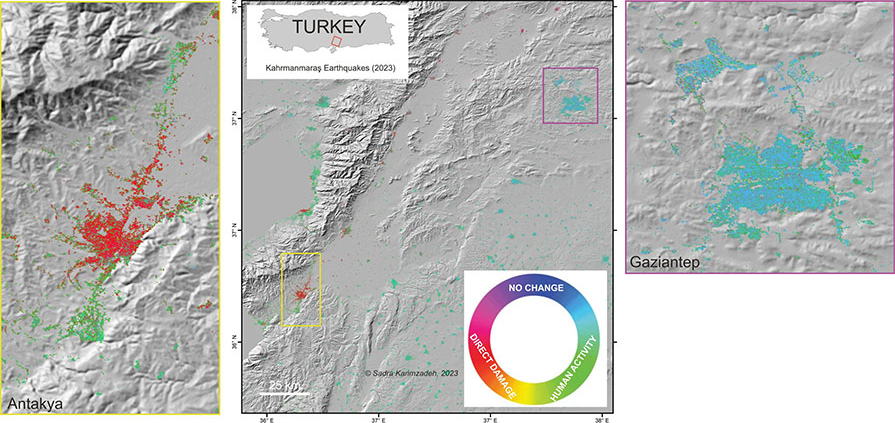
Multitemporal SAR interferometric analysis can provide insight into the mood of each city following the events. Here is a clear example from our RGB damage map that shows direct changes, reverse changes, and stable areas.
Red pixels represent “direct changes” or so-called “damaged” areas. Green pixels represent “reverse changes” that signify human activities, such as debris removal. Blue pixels indicate stable areas in most cases.
The map clearly shows that the presence of debris removal and rescue teams in Antakya is much higher than in Gaziantep, as uncollapsed buildings are more likely to be green in Antakya compared to Gaziantep. Yes, we can even check the mood of cities from space!