News
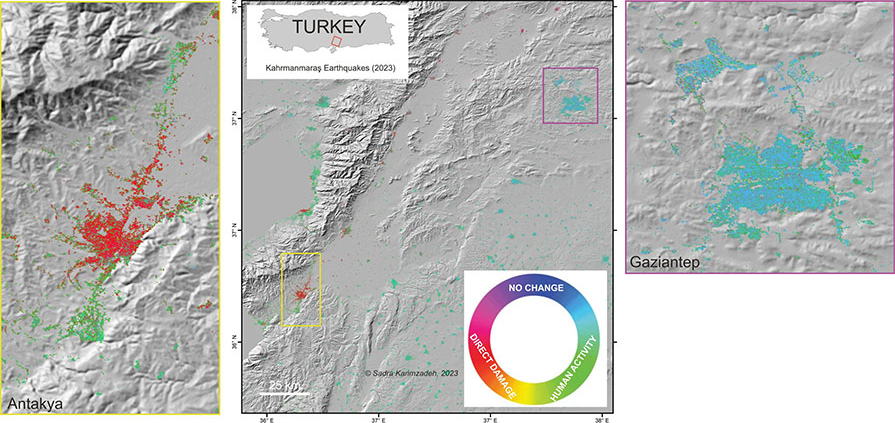
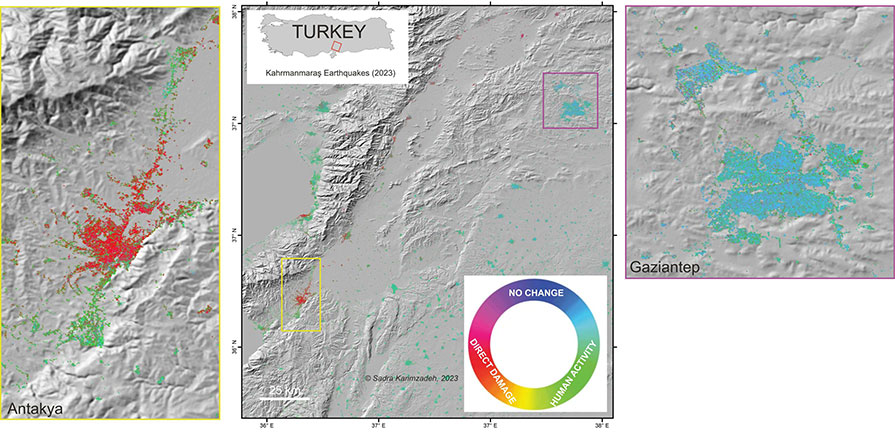
Multitemporal SAR interferometric analysis can provide insight into the mood of each city following the events. Here is a clear example from our RGB damage map that shows direct changes, reverse changes, and stable areas.
Red pixels represent “direct changes” or so-called “damaged” areas. Green pixels represent “reverse changes” that signify human activities, such as debris removal. Blue pixels indicate stable areas in most cases.
The map clearly shows that the presence of debris removal and rescue teams in Antakya is much higher than in Gaziantep, as uncollapsed buildings are more likely to be green in Antakya compared to Gaziantep. Yes, we can even check the mood of cities from space!
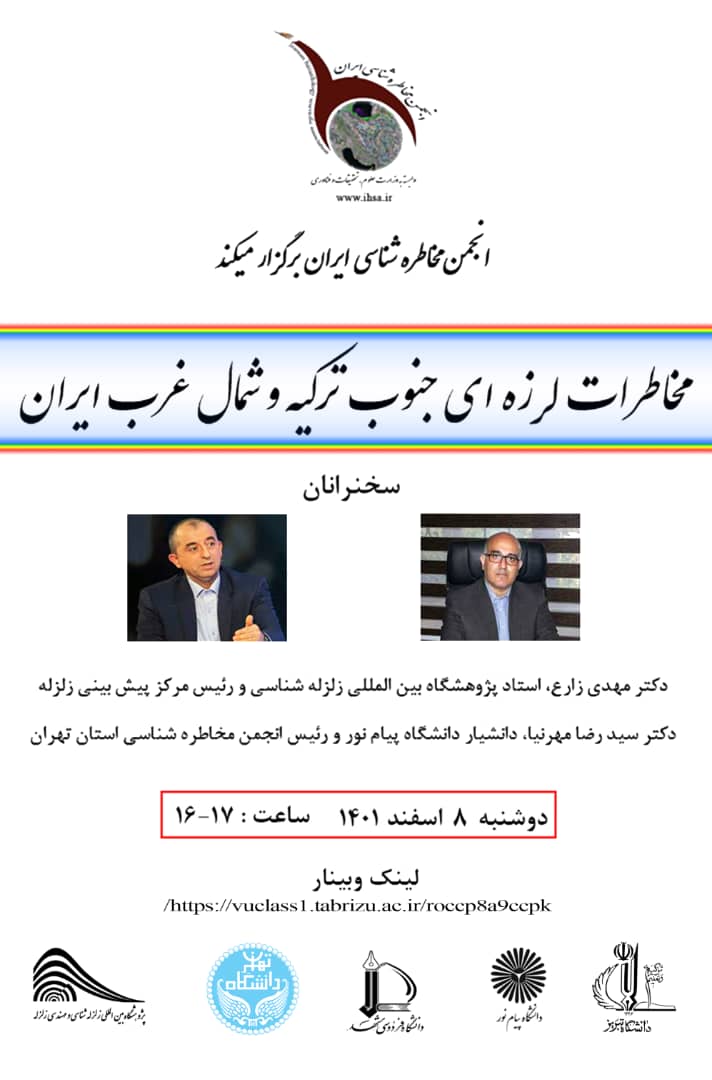
#وبینار
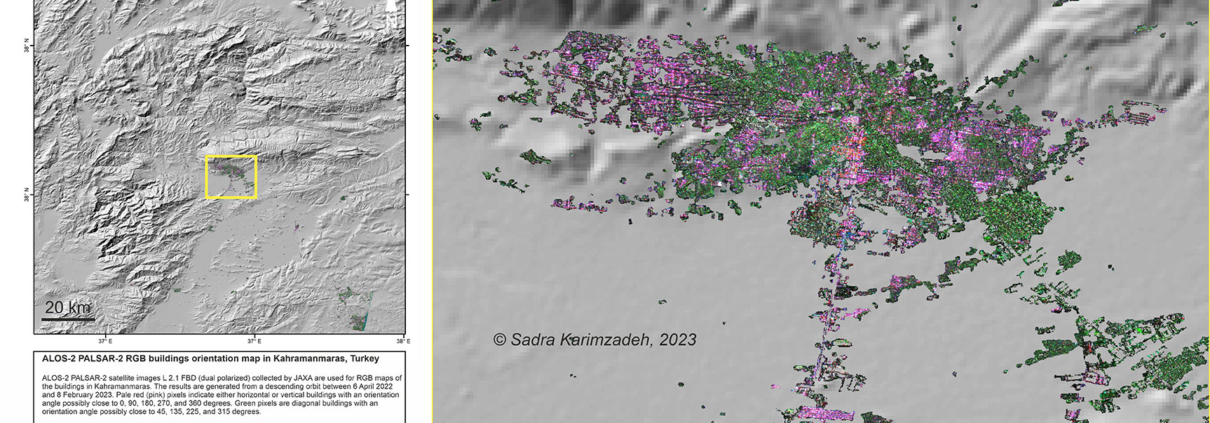
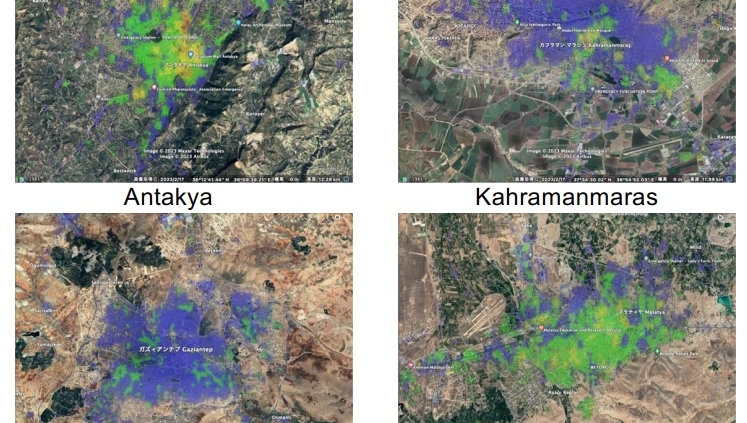
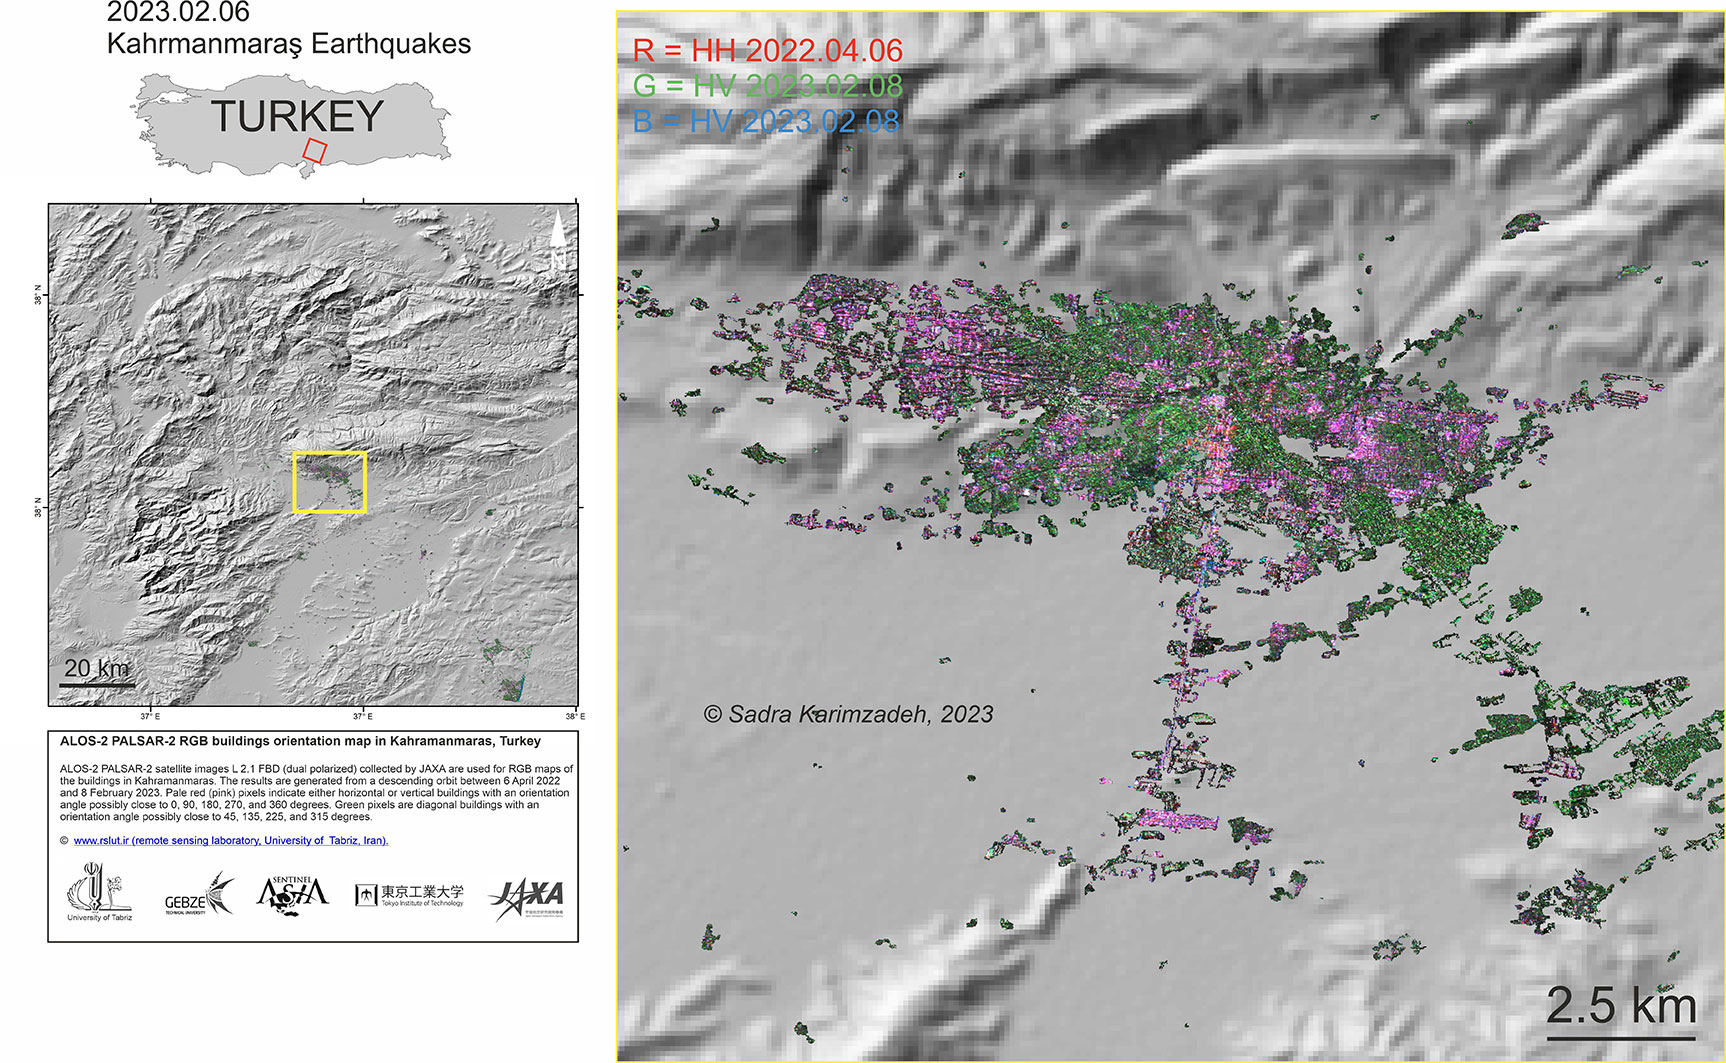
ALOS-2 PALSAR-2 satellite images L 2.1 FBD (dual polarized) collected by JAXA are used for RGB maps of the buildings in Kahramanmaras. The results are generated from a descending orbit between 6 April 2022and 8 February 2023. Pale red (pink) pixels indicate either horizontal or vertical buildings with an orientation
angle possibly close to 0, 90, 180, 270, and 360 degrees. Green pixels are diagonal buildings with an orientation angle possibly close to 45, 135, 225, and 315 degrees.
طی حکمی از طرف رییس انجمن مخاطره شناسی ایران، آقای دکتر صدرا کریم زاده به مدت سه سال بعنوان رییس انجمن مخاطره شناسی شاخه استان آذربایجان شرقی انتخاب شد

 .
.
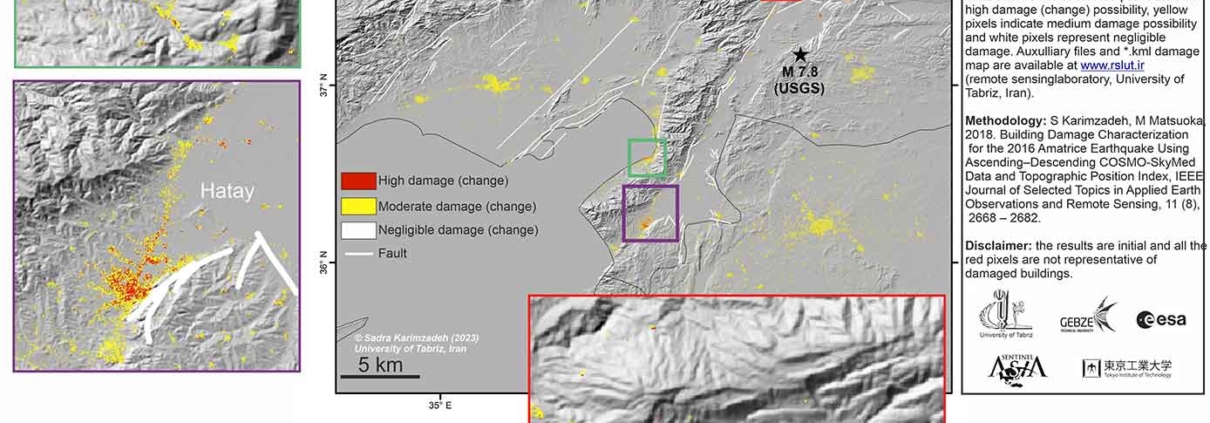
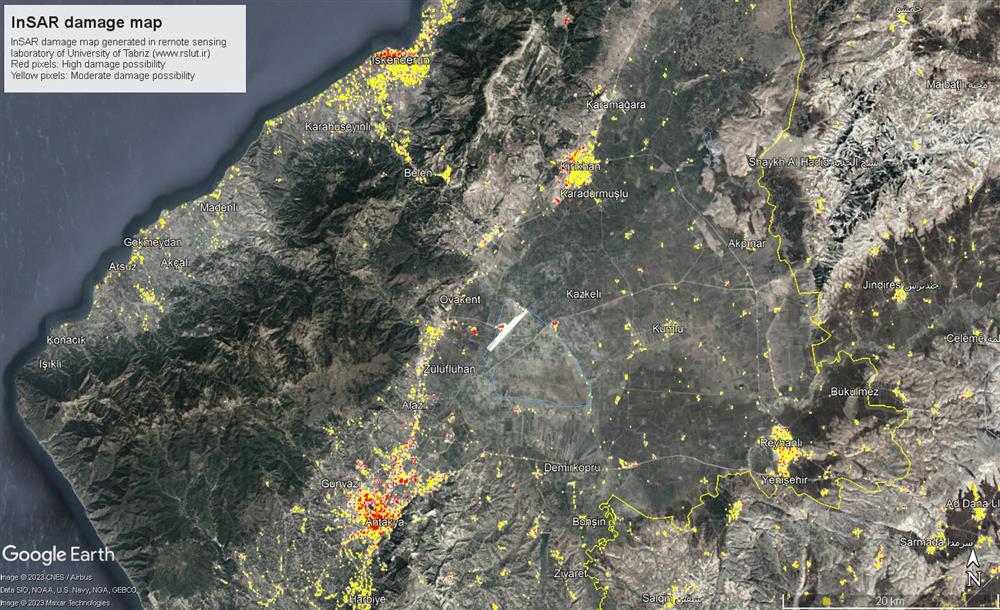
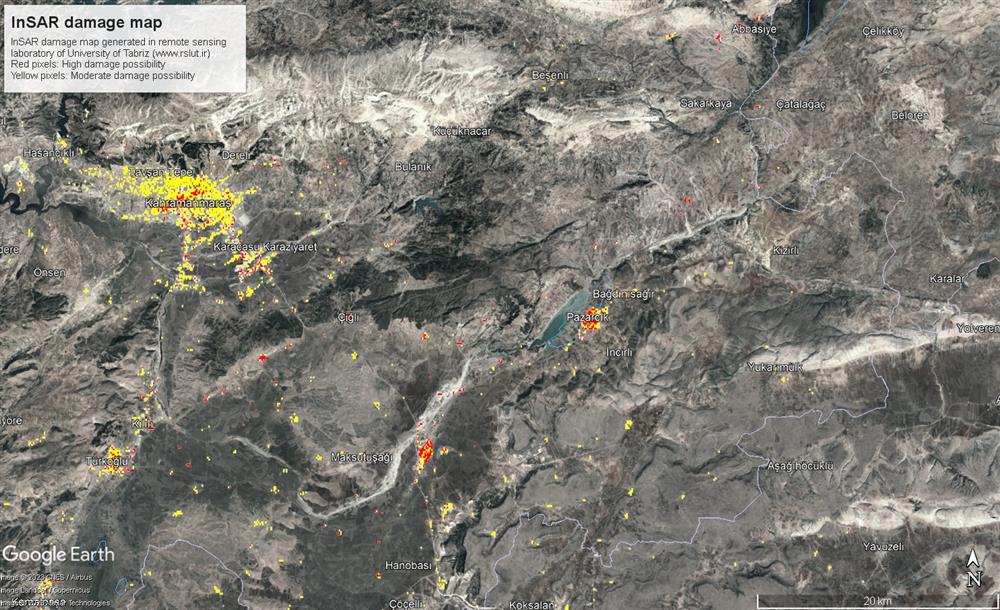
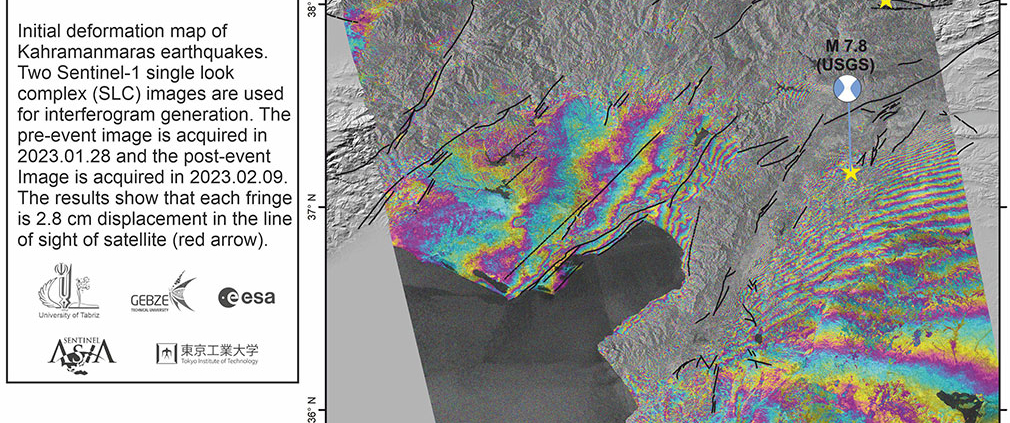
Remote sensing laboratory in University of Tabriz, Iran (www.rslut.ir) in collaboration with Gebze Technical University, Turkey, and Tokyo Institute of Technology, Japan produced the initial damage map of the settlements in Turkey and Syria after M 7.8 and M 7.5 earthquakes. Sentinel-1 satellite images collected by the European Space Agency are used for coherence generation. The results are generated from orbit 14 between 16 Jan. 2023 and 9 Feb. 2023. Red pixels indicate high damage (change) possibility, yellow pixels indicate medium damage possibility and white pixels represent negligible damage.

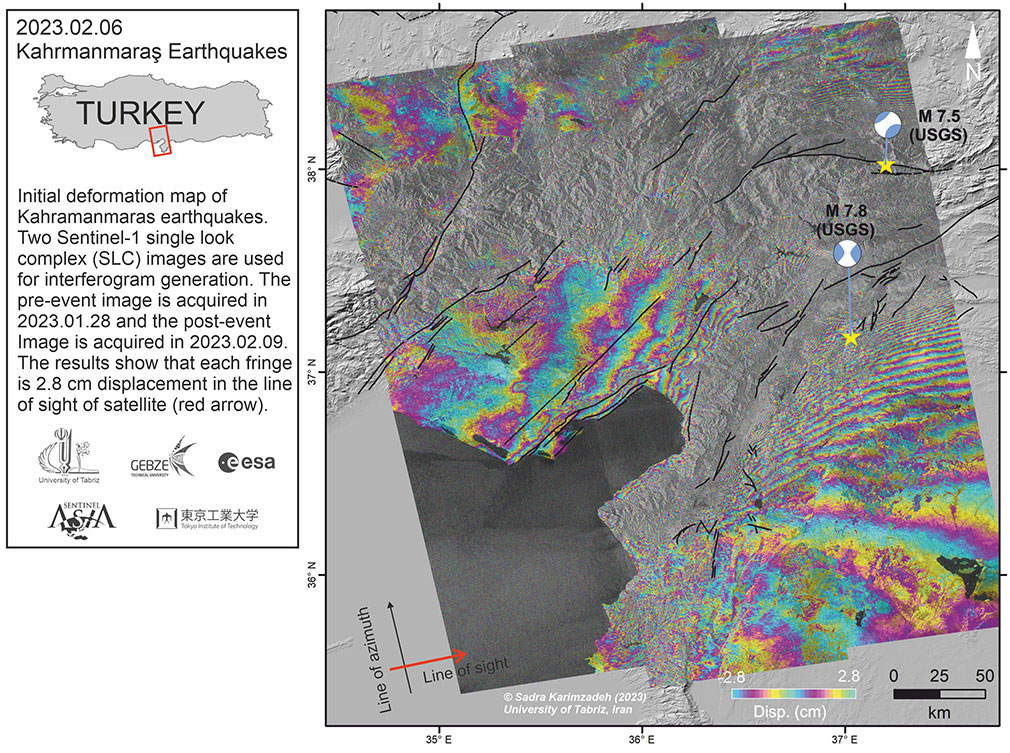
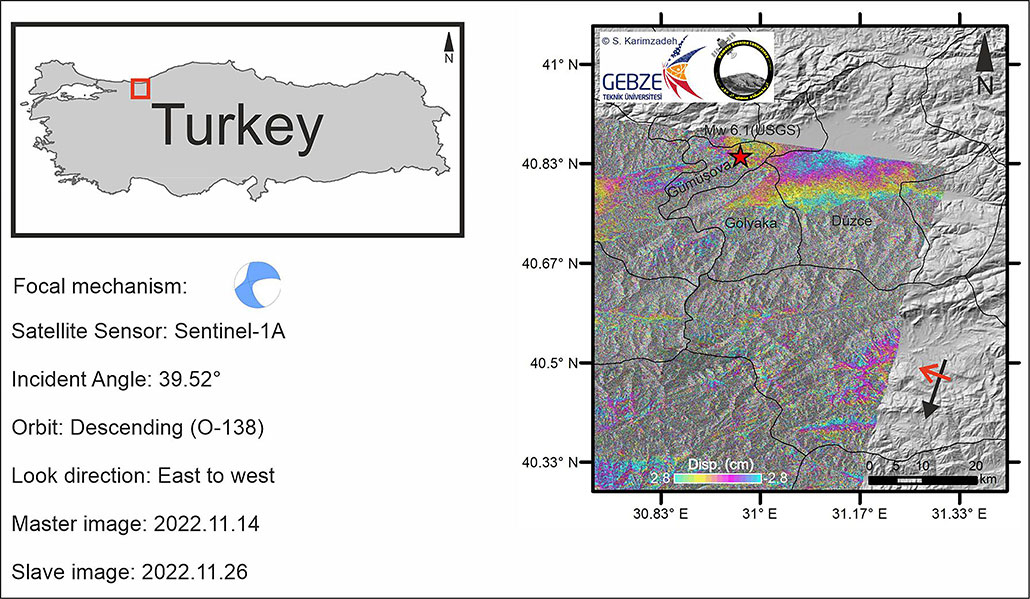
Interferogram in *kml format can be downloaded from here.